Unit 3: Photography Basics
Reading light through the histogram is the best way to ensure your exposure.
Introduction to the Histogram
As we’ve discussed, exposure is one of the most important aspects of a photograph. We’ve covered how to adjust exposure, but how do you accurately review it? That’s where the histogram comes in.
One important thing to remember: never trust your LCD screen to judge exposure. The screen is not designed for accuracy—it’s affected by ambient light, screen brightness settings, and the JPEG preview applied to your raw image. You might think your exposure is correct while shooting, only to realize later that your screen misled you.
A histogram, on the other hand, provides a more objective way to evaluate exposure. It looks the same whether you view it on your camera’s LCD or a professionally calibrated monitor. Typically, digital camera includes a histogram display, usually found in an “image details” mode (check your manual). Many mirrorless cameras also offer a live histogram, which allows you to see how your exposure will look before you take the shot—a very useful feature.
What is a Histogram?
A histogram is a graph that shows the distribution of brightness levels in a photo. It represents the range of tones from dark to light:
Shadows appear on the left.
Midtones are in the middle.
Highlights are on the right.
The height of each part of the graph represents how many pixels in your image contain that particular brightness level. A well-balanced histogram indicates a good mix of shadows, midtones, and highlights—helping you assess exposure and make adjustments to avoid losing important details.
Example Histograms

Dark Shadows
Here, most of the image data is pushed to the left, meaning the image is too dark. Notice that the highlights from the streetlights are minimal in the histogram—they don’t contribute enough brightness to balance the exposure.

Bright Highlights
In this case, the histogram is pushed to the right. The triangle at the top right indicates that some highlights are completely “blown out” (pure white), meaning those details are lost forever and cannot be recovered in editing. You’ll also notice a small bump on the left—this corresponds to a dark area in the image.

Well-Balanced Image
This histogram has a more even distribution across shadows, midtones, and highlights. Even though the photo was taken directly into the setting sun, no significant details are lost in the highlights or shadows.

High-Contrast Image
Here, both the shadows and highlights are very strong. The histogram shows peaks at both ends, with almost no midtones. This means we have deep blacks and bright whites, but very little in between. The highlights from the window are completely blown out, as shown by the peak all the way to the right.
Understanding Histogram Adjustments
The histogram makes it easy to see how adjusting your camera settings affects exposure. Increasing exposure shifts the histogram to the right, while decreasing exposure shifts it to the left. However, if the histogram pushes too far and crashes into either edge, shadows or highlights are clipped, meaning detail is permanently lost.
An “ideal” histogram often resembles a bell curve—spread across the entire width of the graph, reaching near (but not beyond) the edges. This is also what your camera’s light meter generally aims for. A well-exposed raw file gives you maximum flexibility in editing, allowing you to fine-tune brightness and contrast to achieve your creative vision.

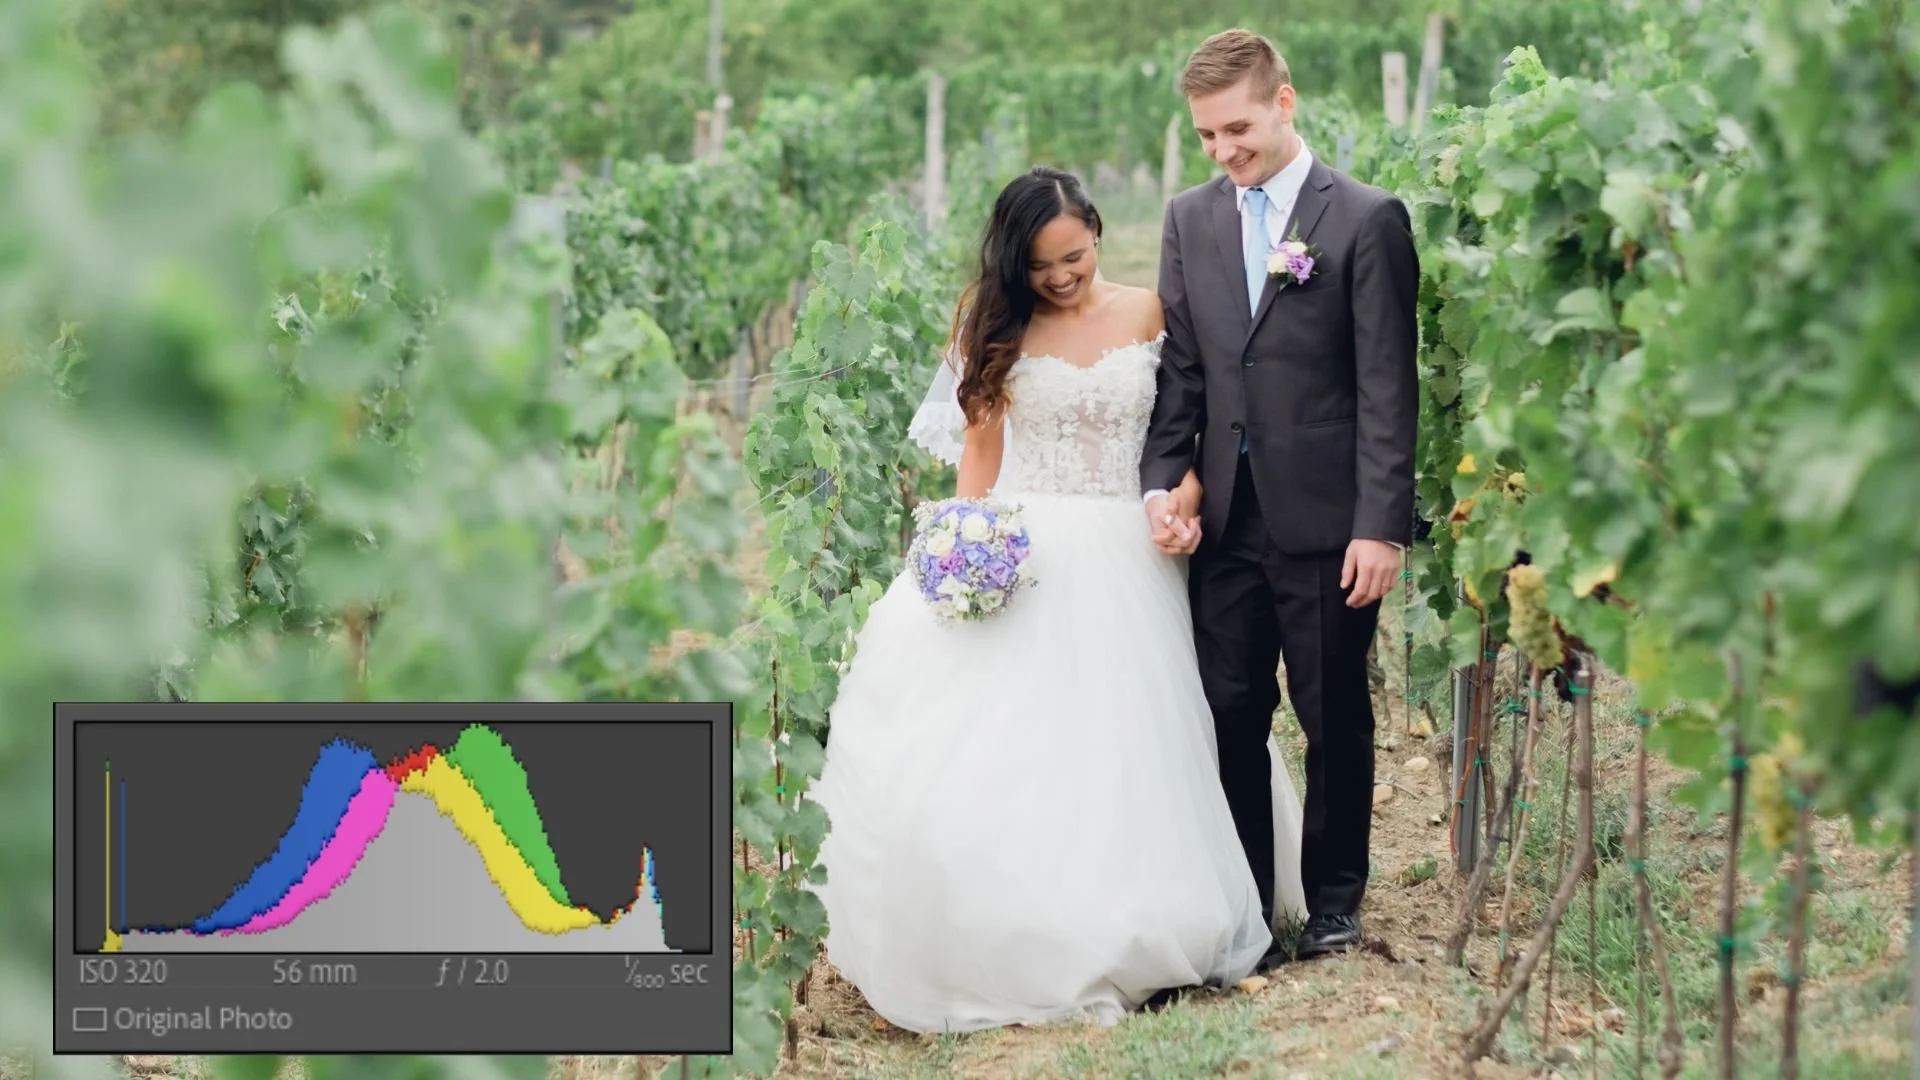
What About Color?
So far, we’ve discussed brightness, but histograms can also show color information.
Color data is divided into three channels: Red, Green, and Blue (RGB).
Some cameras provide individual histograms for each channel, which can be useful when working with strongly saturated colors.
If a color channel is clipped (pushed too far right), you can lose detail in that specific color, even if the overall brightness looks fine.
Important Notes for RAW Shooters
The histogram displayed on your camera is based on the JPEG preview, not your actual raw data.
This means that even if the histogram suggests some detail is lost, you may still be able to recover it when editing the raw file.
The “Expose to the Right” (ETTR) Technique
Digital cameras capture more detail in highlights than in shadows. Because of this, some photographers use a technique called Expose to the Right (ETTR)—pushing the histogram as far to the right as possible without clipping the highlights. This technique can provide cleaner, more detailed images when processed correctly. Try it out and see if it works for your shooting style.